
Ether Data built the place embeddings so that one consistent description of place can sit beside the features a team already uses. The same 128 numbers describe every small area of the country outside Alaska, so a model can carry its sense of place from one market to the next. We designed and trained the model behind them in house.
This guide covers what the embeddings contain, how to join them to records with a location, how we evaluated them and where they have added signal so far.
Each small area gets 128 numbers that describe what kind of place it is
Each cell of the H3 grid at resolution 8, about 0.74 km² on average, carries one vector of 128 numbers.1
Our own model, self-supervised. Ether Data designed and trained it in house, from census attributes and geographic context. No device IDs.2
Standardized. Each of the 128 dimensions has zero mean and unit variance across cells.
Read as geometry, not as columns. The dimensions carry no labels. The information lives in distances and directions: places with similar profiles sit close together, and a direction in the space can line up with a property you care about.
Coverage is 49 states and DC (Alaska is not covered), about 7.6 million cells, one row per H3 cell. The evaluation sample covers ten Northeast states (CT, DE, MD, MA, NH, NJ, NY, PA, RI, VT): 485,701 cells.
| Column | Type | Description |
|---|---|---|
| h3 | STRING | H3 resolution 8 cell index. The join key. |
| state | STRING | Two-digit state FIPS code. |
| H000 … H127 | FLOAT | The 128-number place vector, standardized per dimension. |
You can receive the embeddings two ways: Parquet files that load into any platform, or a shared BigQuery table you query in place. The BigQuery table also carries the vector as a single array column for vector and machine learning operations, and keeps every cell on one national scale, so standardize on your side if a model needs it. You need no SDK or API.
A shared H3 cell attaches the embeddings to any record with a location
The join has three steps. Geocode each record to latitude and longitude, if it is not already. Convert each point to its H3 resolution 8 cell. Join on the h3 column. The PDF carries the code for the join in Python.
Coarser units are averages of the cells inside them: child cells for a parent H3 cell, or a weighted average of the cells inside a ZIP code, county or territory polygon, weighted by population or record counts.
We score the embeddings only on areas held out of training
Neighbouring cells resemble each other, so we hold out whole areas rather than random rows. We group cells by their H3 resolution 5 parent for cross-validation, and for transfer we leave out whole states. We score census features and the embeddings on the same folds, alone and together, and we validate against public targets the embeddings were not built from: night-time lights, terrain elevation and cell-tower locations.3,4,5 The blocked probe we use is a ridge regression scored by R² over five folds grouped by resolution 5 parent; the PDF carries its code.
The embeddings keep their skill in states where census features fail
The embeddings add the most as spatial context that transfers. In our evaluations they add the most on targets that vary smoothly across space, and when the probe predicts in states it was not fitted on.
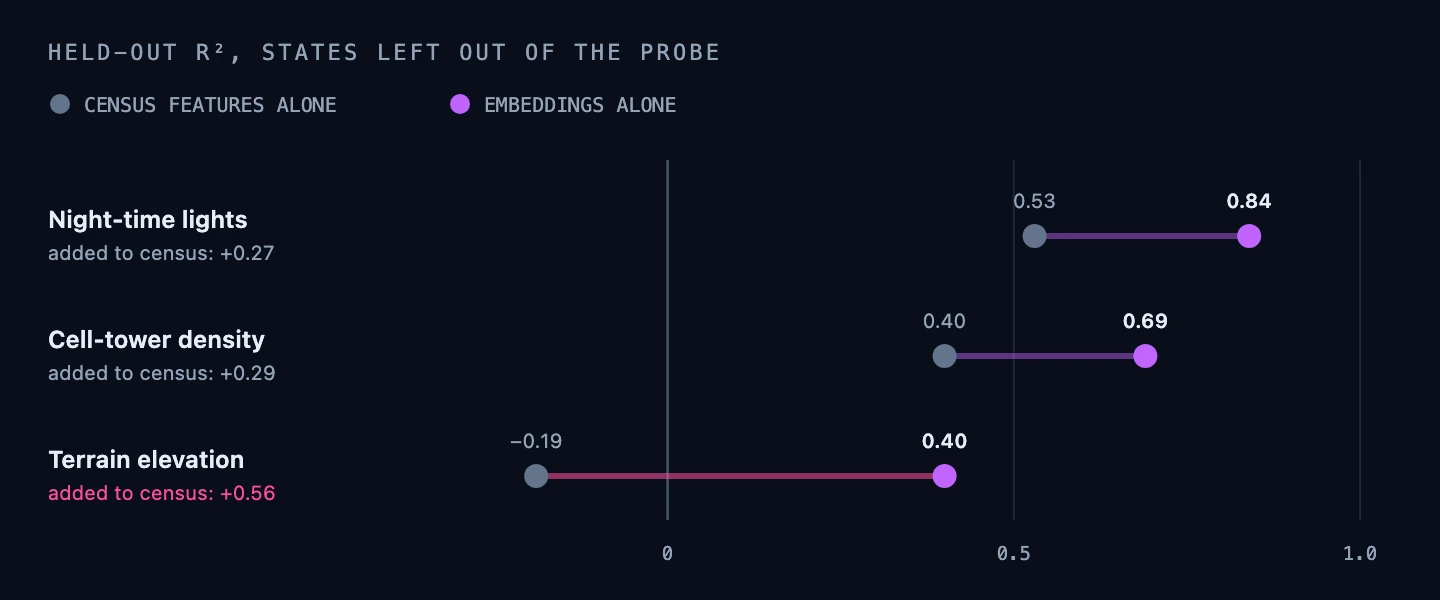
Census features alone score below zero on elevation in held-out states, worse than predicting the average, while the embeddings keep most of their skill. That gap is the transferable context.6

Sources, with the strength of each
Each note names the publisher and the kind of evidence: public statistics, open-source reference, crowdsourced data or Ether Data's own evaluation.
- 1Uber Technologies, H3 hexagonal hierarchical geospatial indexing system. Open-source reference; resolution 8 cells average about 0.74 km². h3geo.org
- 2US Census Bureau, American Community Survey. Federal statistics, one of the inputs to the embeddings. www.census.gov/programs-surveys/acs
- 3Earth Observation Group, VIIRS night-time lights. Public satellite-derived data, used as an evaluation target and not as an input. eogdata.mines.edu/products/vnl
- 4Public terrain elevation data, used as an evaluation target and not as an input.
- 5OpenCellID, open database of cell-tower locations. Crowdsourced, used as an evaluation target and not as an input. opencellid.org
- 6Ether Data, held-out linear-probe evaluation of the current embedding release, November 2026. Ether Data's own evaluation: each state left out in turn, pooled out-of-fold R² on 120,000 sampled cells.
About Ether Data. Ether Data describes what kind of place each small area is and how it changes by hour across the year. It uses no device IDs. This guide reports evaluations on public targets and no client results.