
Purpose
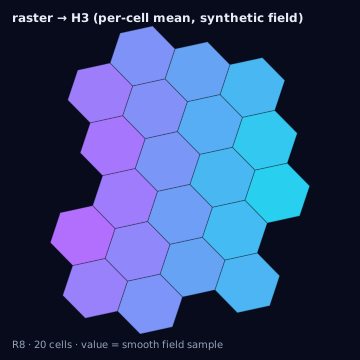
Rasters — land cover, elevation, imagery-derived classifications, gridded population estimates — are regular pixel grids, not vector geometry, so converting one to H3 is a resampling problem: each H3 cell must be assigned a value derived from the (usually several) pixels it overlaps. Which aggregation statistic is correct depends entirely on what the raster's values mean — a mean is correct for a continuous field and wrong for a categorical one, and no single default statistic is safe across raster types.
Source geometry and destination geometry
Source geometry is raster: a regular grid of pixels, each with one or more
band values, a defined CRS, and a resolution (pixel size) that is usually
fixed but occasionally coarser than the target H3 resolution. Destination
geometry is an h3_cell_set where every cell carries one or more derived
attribute values plus the aggregation method used to produce them.
Exactness class
Approximate: a cell's assigned value is always a summary of multiple pixel values (or an extrapolation from a single covering pixel), never a measurement made at the cell's own scale.
Containment rule and boundary behavior — aggregation statistics
The "containment rule" for raster conversion is which pixels count toward a cell's value and how they are combined:
- Center sample
- Value of the pixel containing the cell's center. Cheapest; can miss small features entirely.
- Nearest
- Value of the pixel whose center is nearest the cell's center; steadier than center-sample when grids are offset.
- Mean
- Area-weighted or simple average of overlapping pixels. Correct only for continuous, additive fields — meaningless for category codes.
- Median
- Middle value of overlapping pixels. More outlier-robust than mean for continuous fields; still meaningless for categories.
- Min / max
- Extremum of overlapping pixels. Used for conservative or worst-case summaries, not central tendency.
- Sum
- Total of overlapping pixel values, for count- or density-type rasters meant to be additive (e.g. population per pixel).
- Majority
- Most frequent category among overlapping pixels. The correct default for categorical rasters (land cover, zoning).
- Fractional category
- Per-category area share among overlapping pixels. Retains what majority discards — a 60/40 forest/water cell is not honestly 'forest'.
- Area-weighted
- Any statistic above weighted by each pixel's actual overlap area rather than counted whole. Required once pixel size approaches cell size.
- Confidence-weighted
- Aggregation weighted by a per-pixel confidence/quality band, where the raster ships one. Down-weights low-confidence pixels.
Resolution behavior
The relationship between pixel size and H3 cell size determines which statistics are even meaningful. When cells are much larger than pixels (coarse H3 resolution over fine imagery), mean, median, majority, and fractional-category are all well-supported by many pixels per cell. When cells are smaller than or comparable to pixels (fine H3 resolution over coarse raster data — the common case for climate or population grids), every statistic collapses toward center-sample or nearest, because a single pixel dominates or exactly covers the cell, and no aggregation actually occurs; reporting a "mean" over one pixel is not wrong but implies a precision the data does not have.
Units and CRS
Rasters frequently ship in a projected CRS (UTM zones, Albers Equal Area, Web Mercator) that must be reprojected to EPSG:4326 — or, better, have the overlap computed in the raster's native equal-area projection if one is used, since equal-area projections keep pixel-area weighting accurate, while reprojecting to EPSG:4326 first and then area-weighting in unprojected degrees is a common source of quiet error. State pixel size in meters at the raster's stated resolution, noting that "meters per pixel" for a lat/lon raster varies with latitude unless the raster is already in an equal-area or equidistant projection.
Algorithm
import { normalizePolygon } from "@/lib/geometry/normalize";

// Area-weighted mean for a continuous raster band
function rasterCellValue(cellBoundary, rasterBand, stat = "area-weighted-mean") {
  const overlappingPixels = rasterBand.pixelsOverlapping(cellBoundary);
  switch (stat) {
    case "area-weighted-mean":
      return weightedAverage(
        overlappingPixels.map((p) => p.value),
        overlappingPixels.map((p) => p.overlapAreaM2(cellBoundary)),
      );
    case "majority":
      return modeByOverlapArea(overlappingPixels, cellBoundary);
    case "fractional-category":
      return fractionalCoverageByCategory(overlappingPixels, cellBoundary);
    default:
      throw new Error(`unsupported stat: ${stat}`);
  }
}
The same conversion with the Python bindings (h3-py v4):
import h3
import numpy as np
from shapely.geometry import Point, Polygon

def raster_cell_value(cell, raster_band, transform, stat="mean"):
    # Sample the pixels whose centers fall within the cell's boundary,
    # then aggregate them per the chosen statistic. h3-py has no raster
    # helper, so the sampling loop is written directly against the boundary.
    boundary = Polygon([(lng, lat) for lat, lng in h3.cell_to_boundary(cell)])
    minx, miny, maxx, maxy = boundary.bounds
    col_min, row_min = ~transform * (minx, maxy)
    col_max, row_max = ~transform * (maxx, miny)
    values, weights = [], []
    for row in range(int(row_min), int(row_max) + 1):
        for col in range(int(col_min), int(col_max) + 1):
            px, py = transform * (col + 0.5, row + 0.5)  # pixel center
            if boundary.contains(Point(px, py)):
                values.append(raster_band[row, col])
                weights.append(1.0)  # swap for pixel-overlap area if area-weighting
    if not values:
        return None
    if stat == "mean":
        return float(np.average(values, weights=weights))
    if stat == "majority":
        vals, counts = np.unique(values, return_counts=True)
        return vals[np.argmax(counts)]
    raise ValueError(f"unsupported stat: {stat}")

cells = h3.polygon_to_cells(h3.LatLngPoly(aoi_ring), res=8)
per_cell_mean = {c: raster_cell_value(c, band, raster_transform) for c in cells}
h3.cell_to_boundary gives the polygon to sample against; per-pixel
overlap-area weighting (rather than the point-count weighting shown above)
requires clipping each pixel's own footprint against the boundary with
shapely, exactly as the area-weighted mean does in the TypeScript. The
tested reference implementation for this conversion is the TypeScript in
lib/.
Parameters
Aggregation statistic (must match the raster's measurement scale — categorical versus continuous), H3 resolution, whether area weighting is applied, and which band(s) to aggregate for multi-band rasters.
Outputs
An h3_cell_set with one or more attribute values per cell, the
aggregation statistic used, the source raster's native resolution and CRS,
and — for fractional-category output — a nested distribution rather than a
single scalar per cell.
Quality metrics
Report the pixel-to-cell area ratio (source raster resolution versus H3 cell area) as the primary diagnostic: a ratio far from 1 signals either over-aggregation (many pixels compressed into one statistic, losing variance) or under-aggregation (one pixel stretched across many cells, manufacturing false spatial precision). For categorical rasters, report the majority statistic's own confidence — the winning category's share of overlapping-pixel area — since a 34 percent plurality reported as "the" land cover is materially weaker evidence than a 90 percent majority.
Edge cases
Resolution mismatch is the central failure mode: choosing an H3 resolution finer than the raster's native pixel size does not create information, it interpolates it — every cell within a single source pixel reports an identical value with a false appearance of cell-level precision. Always cap the usable H3 resolution to where pixel-to-cell ratio stays well above 1. Nodata values (masked pixels, flagged by a sentinel like -9999 or a separate mask band) must be excluded from every statistic explicitly; averaging a sentinel into a mean silently corrupts any cell touching a masked pixel, common at tile edges and over water in land-only datasets. Coastal pixels compound this: many environmental and demographic rasters mask ocean as nodata, so a shoreline cell can have most of its overlapping pixels excluded, and naive aggregation either extrapolates the land value across the whole cell or wrongly suppresses a cell that is mostly valid land. Area-weighted aggregation over only the valid pixels, with the valid-area fraction reported alongside the value, is the correct treatment.
Assumptions and limitations
This conversion assumes the raster's value semantics (categorical versus continuous, additive versus rate) are known before an aggregation statistic is chosen; there is no statistic that is safe to apply by default across raster types, and applying mean to a categorical raster or majority to a continuous one produces a value that is syntactically valid and substantively meaningless. It also assumes the raster's stated resolution and CRS metadata are accurate — an unlabeled or mislabeled raster should be inspected before conversion, since resolution-mismatch handling depends entirely on knowing the true pixel size.